Introduction
Tattoo shops in large cities like Los Angeles face fierce competition. With dozens of well-known parlors and artists competing for attention, standing out online can make or break a shop’s ability to bring in steady business. While many shops rely on word of mouth or social media, Google’s Business Profile is often the first place potential clients land when they search for services.
This case study follows the six-month performance of a Los Angeles tattoo shop that began focusing on its Google Business Profile in March 2025. By introducing locally relevant content, optimizing for nearby neighborhoods, and tying in commentary around trending tattoo culture, the shop was able to grow both its visibility and direct customer interactions.
Starting Numbers
In March 2025, the shop’s online visibility was limited. Looking at the numbers:
- Calls: 76
- Website Clicks: 142
- Overall Interactions: 320
These starting figures show that while people were finding the shop, it wasn’t a major player yet in local search. A few dozen calls and just over 140 monthly clicks meant that opportunities were being missed, especially in a market as big as Los Angeles.
Goals
The primary goals were clear:
- Increase customer calls, ideally hitting well over 200 calls per month within half a year.
- Push website clicks beyond 500 per month, making the website a primary entry point for booking and inquiries.
- Drive overall interactions to a point where the tattoo shop became one of the more visible and trusted names in the Los Angeles tattoo market.
To achieve this, our content approach aimed at ranking for high-value searches such as “tattoo shop near me,” “custom tattoo Los Angeles,” and “fine line tattoos LA.” By targeting location-based terms and creating content around popular tattoo trends, we positioned the shop to capture intent-driven searches from people ready to book.
Business Profile Calls
The calls chart shows strong growth momentum from the start.
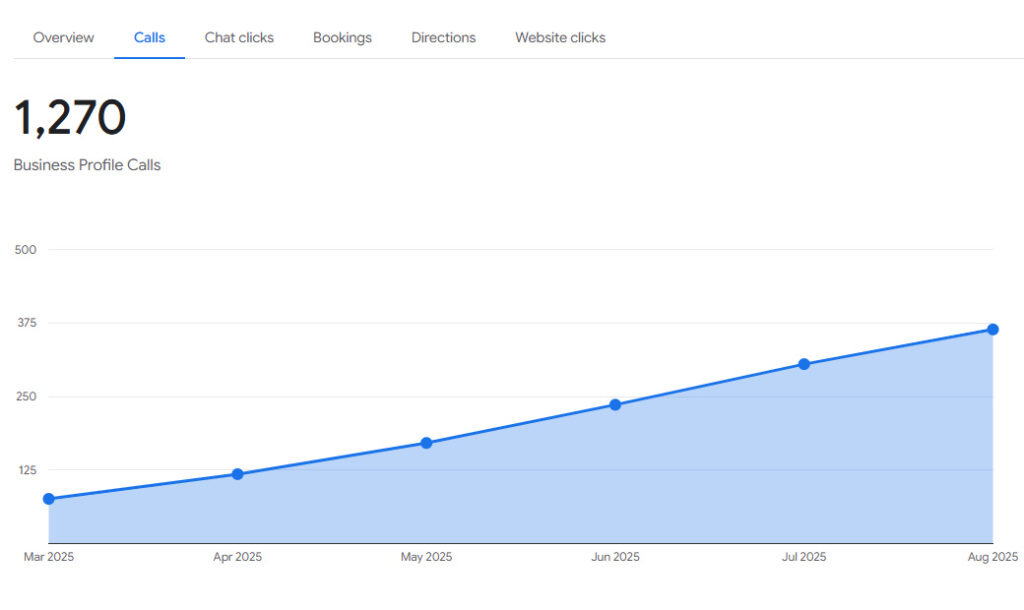
| Month | Calls | Month-over-Month Change | Cumulative Growth % |
|---|---|---|---|
| Mar 2025 | 76 | – | – |
| Apr 2025 | 118 | +55% | +55% |
| May 2025 | 171 | +45% | +125% |
| Jun 2025 | 236 | +38% | +210% |
| Jul 2025 | 305 | +29% | +301% |
| Aug 2025 | 364 | +19% | +379% |
The shop began with 76 calls in March and climbed steadily each month. By August, calls nearly quintupled, reaching 364. The largest jumps came between April and June, before growth tapered into steadier gains in July and August. This mirrors the strategy’s rollout: heavier pushes of local content early on, followed by reinforcement and consistency in the later months.
Website Clicks
Website clicks showed even sharper increases, with particularly large jumps early in the campaign.
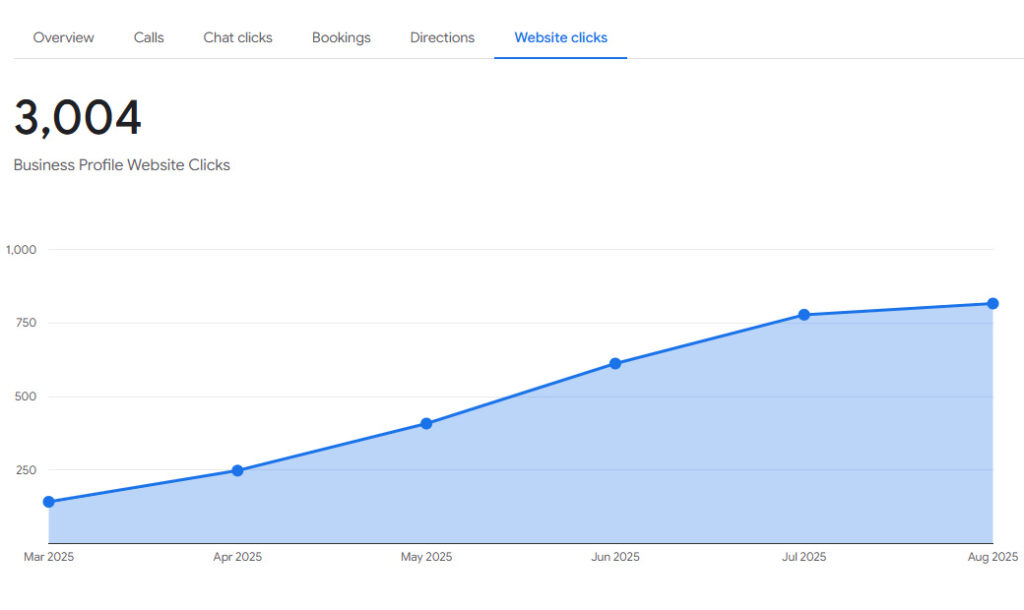
| Month | Clicks | Month-over-Month Change | Cumulative Growth % |
|---|---|---|---|
| Mar 2025 | 142 | – | – |
| Apr 2025 | 248 | +75% | +75% |
| May 2025 | 408 | +65% | +187% |
| Jun 2025 | 612 | +50% | +331% |
| Jul 2025 | 778 | +27% | +448% |
| Aug 2025 | 816 | +5% | +475% |
From a modest 142 clicks in March, the shop’s site was drawing more than 800 clicks per month by August. The most dramatic growth came between April and June, where heavy emphasis on new tattoo-related content and keyword targeting paid off. Growth flattened slightly in July and August, reflecting natural stabilization after a big surge.
Overall Interactions
Overall interactions captured the combined impact of calls, clicks, and other actions.
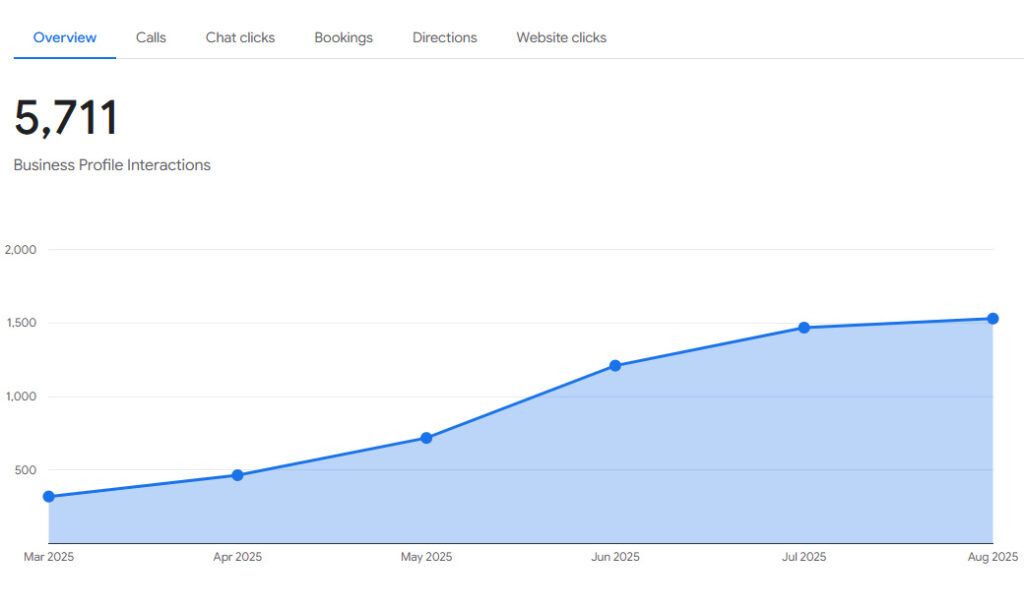
| Month | Interactions | Month-over-Month Change | Cumulative Growth % |
|---|---|---|---|
| Mar 2025 | 320 | – | – |
| Apr 2025 | 465 | +45% | +45% |
| May 2025 | 718 | +54% | +124% |
| Jun 2025 | 1,210 | +69% | +278% |
| Jul 2025 | 1,468 | +21% | +359% |
| Aug 2025 | 1,530 | +4% | +378% |
The trajectory shows how powerful Google Business Profile optimization can be when paired with a strong local content strategy. The shop went from 320 interactions in March to over 1,500 in August. Like calls and clicks, the largest leaps occurred in the middle months, with growth stabilizing by late summer.
Why This Works
Google rewards businesses that demonstrate local relevance. By creating fresh content around Los Angeles neighborhoods, popular tattoo styles, and cultural trends, the shop gave search engines reasons to trust it as a go-to tattoo provider. This also reassured potential customers, who found the shop showing up when they searched for tattoos near them.
Overall Impact Summary
- Calls grew from 76 to 364, a 379% increase.
- Website clicks grew from 142 to 816, a 475% increase.
- Overall interactions rose from 320 to 1,530, a 378% increase.
In six months, the shop transformed from having modest visibility to becoming a go-to choice in a highly competitive market.
Projections
Based on the growth curve, we can project where the tattoo shop may land at month 9 and month 12. The numbers suggest a leveling-off trend as the shop matures into a top search result.
| Month | Calls | Website Clicks | Interactions |
|---|---|---|---|
| Nov 2025 (Month 9) | 420 | 940 | 1,680 |
| Feb 2026 (Month 12) | 455 | 1,020 | 1,740 |
By the end of the first year, it’s realistic to expect nearly 500 calls per month, over 1,000 website clicks, and around 1,700 interactions. The flattening of growth reflects natural stabilization as the shop reaches top visibility in its area.
Closing Summary
This Los Angeles tattoo shop’s growth shows the power of steady, locally focused content. In just half a year, calls grew by nearly 380%, website clicks by 475%, and overall interactions by 378%. These numbers highlight how a business can go from being just another name in the search results to one of the top choices for customers ready to spend money.